ARIA Packet Intelligence app
This application has been developed and is supported by ARIA Cybersecurity Solutions. In the case of technical support questions, please contact our support team at support@ariacybersecuritysolutions.com for assistance.
Product Description: The ARIA Packet Intelligence application, by ARIA Cybersecurity, creates unsampled NetFlow or IPFIX metadata for every network packet. This allows for the detection of network-borne attacks, including ransomware, malware, APTs and intrusions early in the kill chain before significant harm occurs.
App Description: The ARIA Packet Intelligence app developed for Sumo Logic provides visualization and profiling of all internal network traffic, within a Sumo environment, to detect possible threats and verify connectivity policies.
The app consists of the following dashboards:
| Dashboard | Description |
|---|---|
| Threat Summary | Provides a drill down summary of critical threats and attacks, as well as a view of an organization’s current security posture. |
| Network Traffic Visibility | Provides summary and drill down views as to what is communicating within the network environment. |
Log Types
The ARIA Packet Intelligence app uses Netflow Logs to provde the visibility of internal network traffic that can be leveraged, via queries, to
- Create analytics on network performance and connectivity
- Detect network behavior that could indicate threat activity such as the spread of malware or ransomware
Sample Log Message
498 <17>1 2020-02-18T18:15:27Z sia-521293 {“hostName”:”sia 521293″,”product”:”ARIA SDS PI”,”metaData”:{“flowID”:413189632,”flowStart”:1582049544,”flowEnd”:1582049544,”pktsSent”:1,”pktsRcvd”:0,”bytesSent”:90,”bytesRcvd”:0,”srcMac”:”80:e8:6f:84:82:c0″,”dstMac”:”00:1b:17:00:01:11″,”vlanId”:0,”srcIP”:”10.6.0.69″,”dstIP”:”50.205.244.112″,”srcTOS”:0,”dstTOS”:0,”l4Proto”:17,”srcPort”:42941,”dstPort”:123,”tcpFlags”:16}}
Query sample
_sourceCategory=aria/netflow
//The following query maps external destination addresses sourced from the internal network
// Categorize the source address of the traffic seen as either internal or external based on comparison to defined (RFC 1918) ipv4 private addressing. Site specific private addresses can be added.
//
| if(( compareCIDRPrefix(“10.0.0.0”, metadata.srcip, toInt(8)) OR
compareCIDRPrefix(“172.16.0.0”, metadata.srcip, toInt(12)) OR
compareCIDRPrefix(“192.168.0.0”, metadata.srcip,
toInt(16))),”internal”,”external”) as srcip_type
//
// Categorize the destination address of the traffic seen as either internal
or external based on comparison to defined (RFC 1918) ipv4 private
addressing. Site specific private addresses can be added.
//
| if(( compareCIDRPrefix(“10.0.0.0”, metadata.dstip, toInt(8)) OR
compareCIDRPrefix(“172.16.0.0”, metadata.dstip, toInt(12)) OR
compareCIDRPrefix(“192.168.0.0”, metadata.dstip,
toInt(16))),”internal”,”external”) as dstip_type
//
// specify that we look at internal sourced traffic only
//
| where ((dstip_type=”external”) AND (srcip_type=”internal”))
//
// map all of the external addresses communicating with internal addresses
//
| lookup latitude, longitude, country_code, country_name, region, city, postal_code from geo://location on ip = metadata.dstip
| count by latitude, longitude, country_code, country_name, region, city, postal_code
Collect Logs for the ARIA Packet Intelligence app
Below are instructions on how to configure the log collection for the ARIA Packet Intelligence app for Sumo Logic, as well as sample log messages and a query example from an ARIA Packet Intelligence App predefined dashboard.
Collection process overview
Configuring log collection for ARIA Packet Intelligence includes the following tasks:
- Create a hosted collector with a Cloud Syslog source
- Define the destination for the logs
- Configure syslog forwarding in the ARIA Packet intelligence Applications
- Verify logs ingest in Sumo Logic
Step 1. Create a hosted collector and Cloud Syslog source
In this step you configure a hosted collector with a Cloud Syslog source that will act as Syslog server to receive logs from ARIA Packet Intelligence.
To configure a hosted collector with a Cloud Syslog source, do the following:
- Log in to Sumo Logic and create a Hosted Collector.
- Create a Cloud Syslog Source on the hosted collector, specifying the following:
- Click Save.
- Copy the Token, host URL and TCP TLS Port to a safe place. You will need this information in the tasks that follow.
a. Enter a Source Name.
b. Provide a Source Category: aria/netflow
Step 2. Define the destination for the logs
In this step you will configure the ARIA netflow exporter where you can define the log destination. This will be the host name, port and protocol (TLS) of the Sumo Logic Cloud Syslog source.
To enable netflow export to Sumo Logic, do the following:
- Login in to the ARIA SDS orchestrator
- Select Deployed services > PacketIntelligence > Flow Exporters
- Select Add new Sumo Logic Exporter
- Provide the following information in the dialog box:
- Close the dialog box to commit the changes
a. Sumo Logic format: syslog
b. Exporter Name: Netflow_export_to Sumo_Logic
c. Category: aria/netflow
d. URL: URL from Step 1
e. Syslog Protocol: TCP
f. Syslog Port: Port from Step 1
g. Syslog Severity: 6
h. Syslog Facility: 16
i. Syslog Token: Token from Step 1
j. Check “enabled”
Step 3. Verify netflow export in ARIA Packet Intelligence
- Log into the ARIA SDS orchestrator
- Select Deployed services > PacketIntelligence > Stats & Health > Flow
- Verify that flows are being created and emitted
Install the ARIA Packet Intelligence app and View the Dashboards
This page has instructions for installing the ARIA Packet Intelligence app for Sumo Logic , as well as descriptions of each of the app dashboards.
To install the app, do the following:
Locate and install the ARIA Packet Intelligence app from the Sumo Logic App Catalog. If you want to see a preview of the dashboards included with the app before installing, click Preview Dashboards.
- From the App Catalog, search for and select the app.
- To install the app, click Add to Library and complete the following fields.
i. App Name. You can retain the existing name, or enter a name of your choice for the app.
ii. Data Source. Select either of these options for the data source.
a. Choose Source Category and select the source category you set in the Collect Logs section (e.g. aria/netflow).
b. Choose Enter a Custom Data Filter and enter a custom source category beginning with an underscore. Example (_sourceCategory=aria/netflow).
iii. Advanced. Select the Location in Library (the default is the Personal folder in the library) or click New Folder to add a new folder.
iv. Click Add to Library.
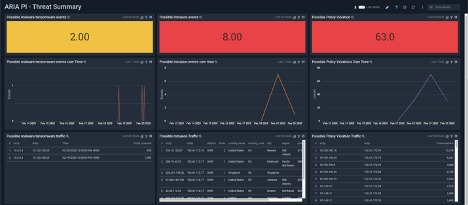
ARIA PI – Threat Summary Dashboard
The Threat Summary Dashboad provides a summary of possible threat and policy violations based on query driven network behavior analysis. – i.e. Use this dashboard to:
- Automatically detect possible internal network threats including Ransomware, Malware, APTs and Intrusions
- Detects attacks involving IoT, including network connectivity policy violations
- Track Security Posture
ARIA PI – Network Traffic Visibility Dashboard
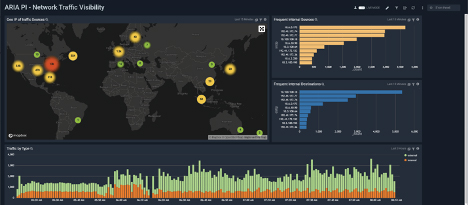
The Network Traffic Visibility Dashboad is used to obtain a summary and drill down views as to what is communicating within your organization – i.e. Use this dashboard to:
- View Frequent “Talkers”
- See a map of external “Talkers”
- View Internal vs external traffic
- Allow for drill down to device level